


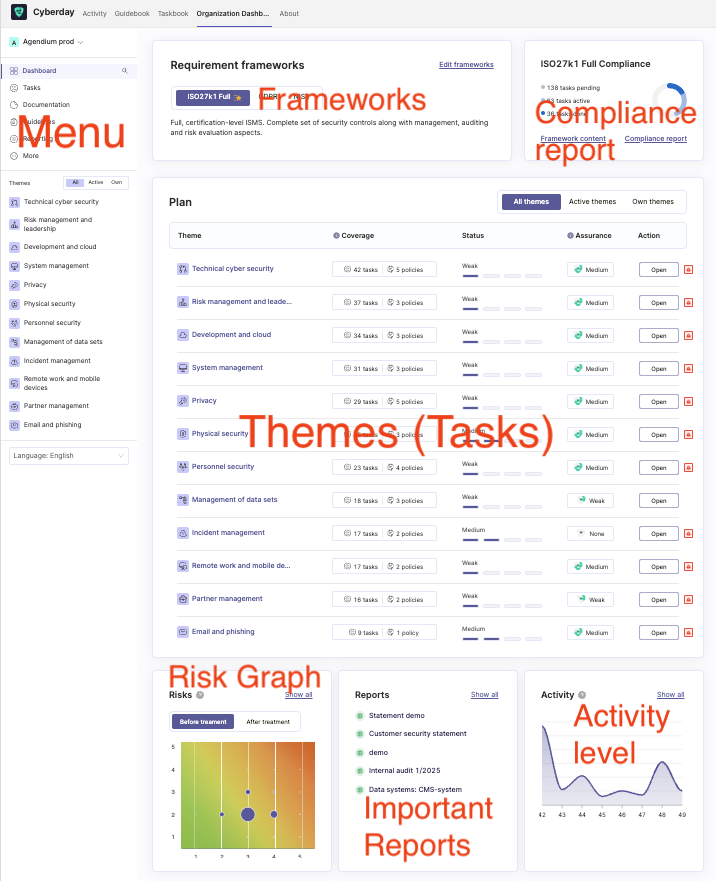
The Organisation Dashboard in Cyberday is the most important tab and view for the the cyber security work involved team. It shows:
- the main menu on the left with access to the content (tasks, guidelines, documentation and reporting)
- overview of the activated frameworks
- the management system with all of the different themes
- your collaboration groups (if you are a part of one or more)
- a risk map (on the right, only if the "Risk autopilot" is activated)
- quick link to the created reports (on the right)
- an activity graph that shows the total amount of events from the past 2 months
- set the language
Who can access the organisation dashboard?
However, not every employee has access to the organisation dashboard. Only admins, team members and in certain situations also external users can view the organisation dashboard. Admins and team members can also work with the themes and tasks and not only see those. You can read more about the user rights and who can view and edit what in Cyberday here.
Primary Framework-Selection
The framework selection box will show you a brief overview of the by you currently activated frameworks, as well as the current compliance level progress for the frameworks. You can mark a framework as the primary framework by clicking "☆ SET AS PRIMARY". You can get more detailed information about the selected frameworks by clicking either "Show framework content" or "Open compliance report" from the card. If you click on "Edit frameworks" (see screenshot above), you will get to the framework library in Cyberday.
Themes evaluation
When you are creating a fresh Cyberday account, you can start by evalutaing your current status of the individual themes (and tasks). After that, you can start the more detailed work in your policies.
Themes overview
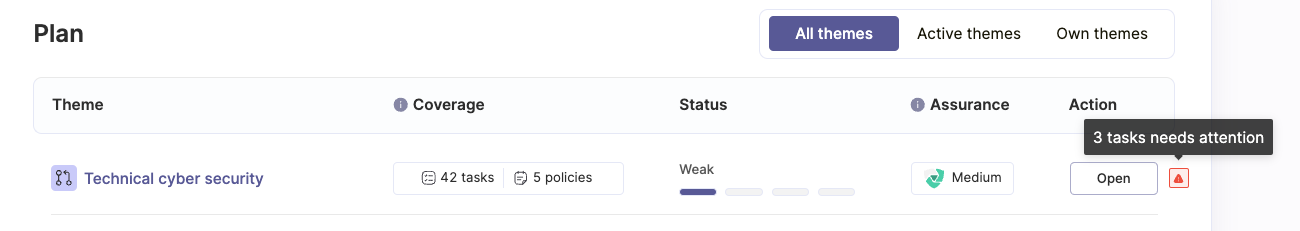
The themes are including the main part of your cyber security work: the tasks, which are representing the requirements of the framework(s). You can filter in the dashboard view if you want to see
- the themes you own
- the themes, which are active in your ISMS at the moment
- all of the themes.
Each of the themes is showing you the amount of policies and the current process with the policies. You can also see the amount of tasks and the progress of the tasks, thanks to the progress bar in purple. If you see a red triangle next to the task progress bar, it means some tasks in that theme need attention. If you go with your mouse over the triangle, you can see how many tasks require attention.
Activity info graph
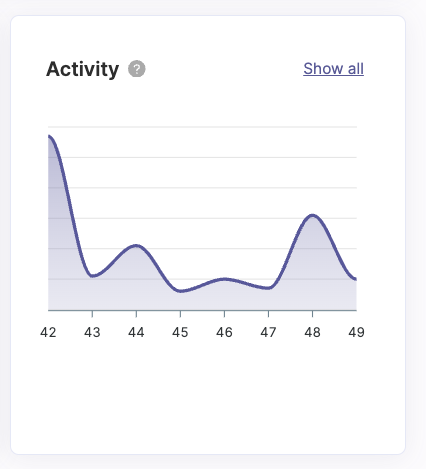
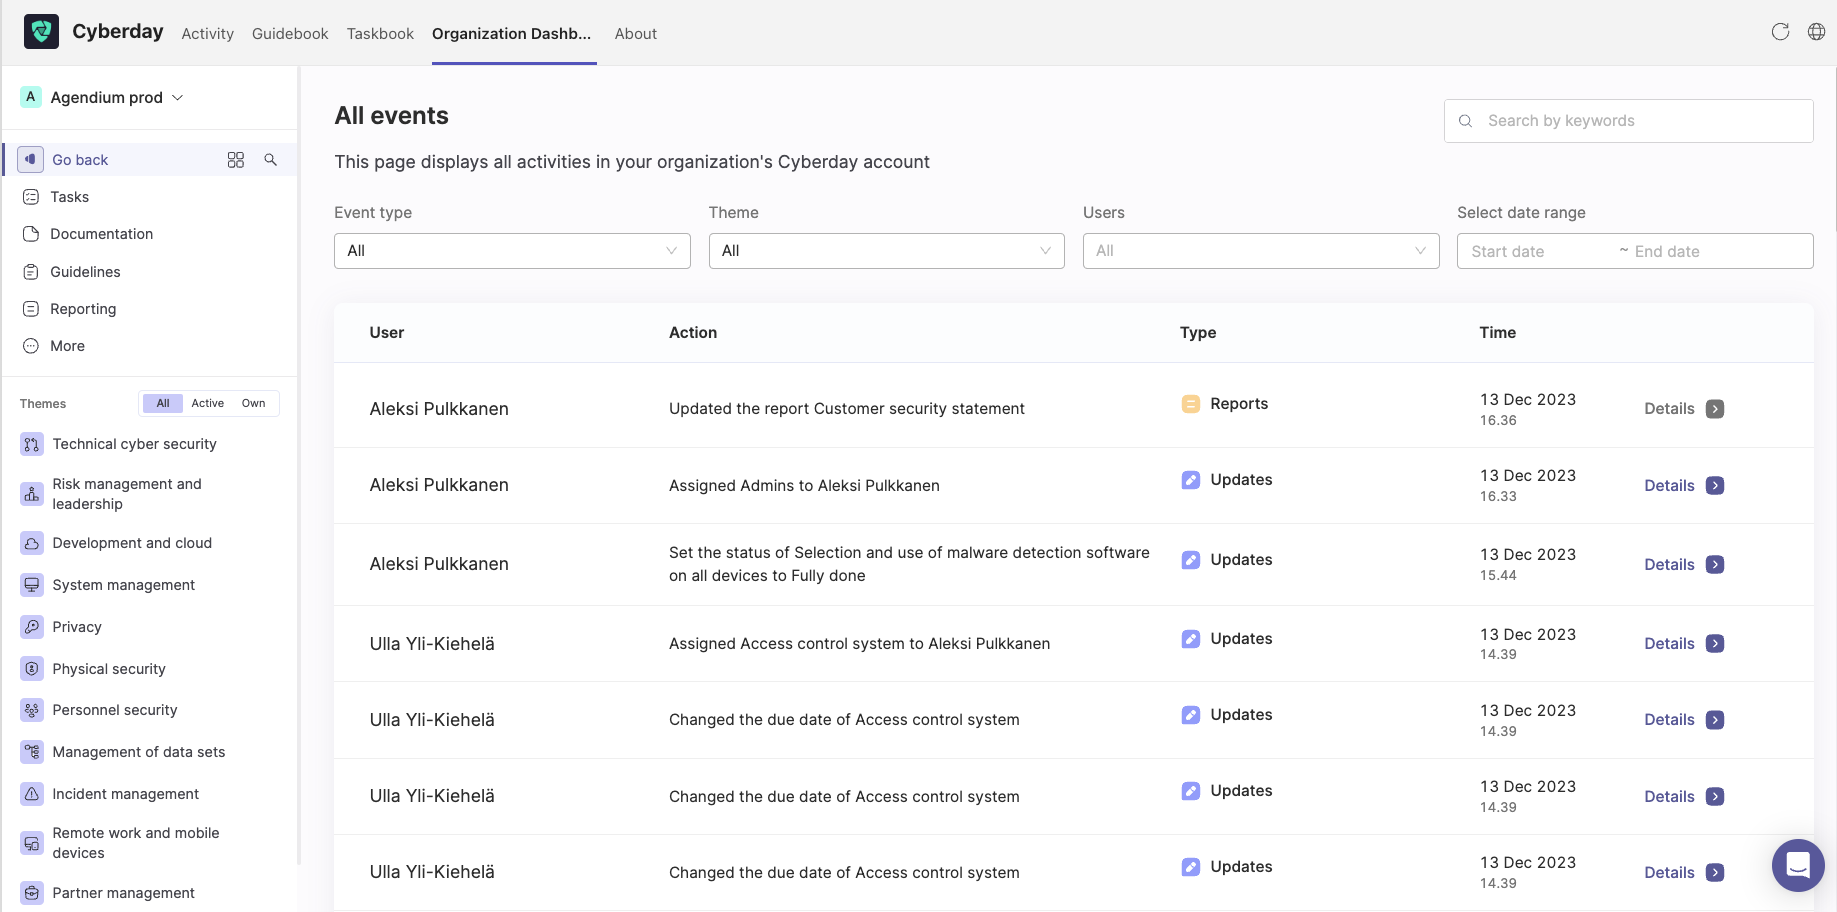
The info graph on the lower right side of the organisation dashboard shows you an overview of the weekly total amount of event for the past 8 weeks. If you click "Show all" in the upper right corner of the graph, you will get to an overview in log format. The overview can be filtered, i.e. if you would like to see only what new guidelines or new comments have been added. You can follow all of the latest activities from that view. Simply choose an event type, theme, user or date range from either of the drop-downs on top of the log to filter the events.
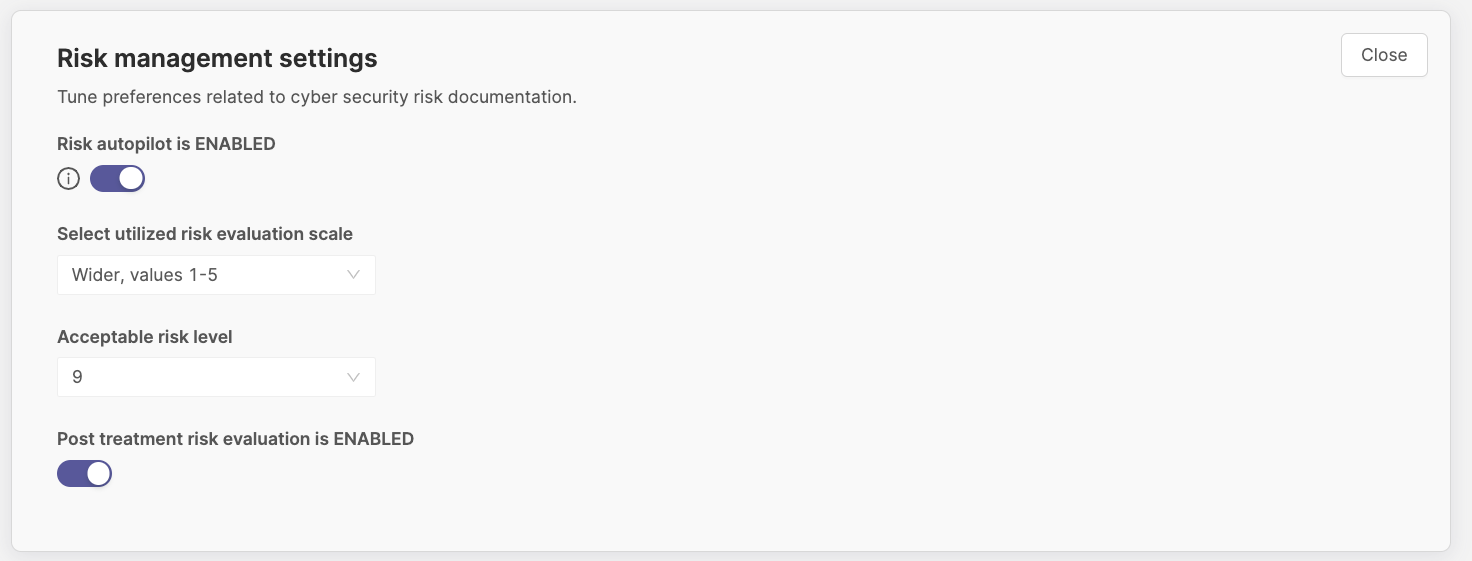
Risks info
The risk info matrix shows a digest of evaluated risks. Underneath the matrix are two options for what the matrix should show you: before and after treatment. If you would not like to see this matrix, disable the "Risk autopilot" from the Settings like this:
- Go to Settings (from the menu on the left)
- Select "Expand" from the topic "Risk management settings"
- Move the slider to the left to deactivate and to the right to activate the autopilot and show the matrix
- Optional: select a scale if you would like to use the matrix
Report card feature
On the right side, you can also see the report card, showing created reports for you to access via one-click from the dashboard. If you would like to access all of the reports, simply click "Show all" to directly jump to the report section in Cyberday. The report page then will show all reports you've created and additionally all available report templates for your active frameworks. Learn more about reporting in Cyberday here.
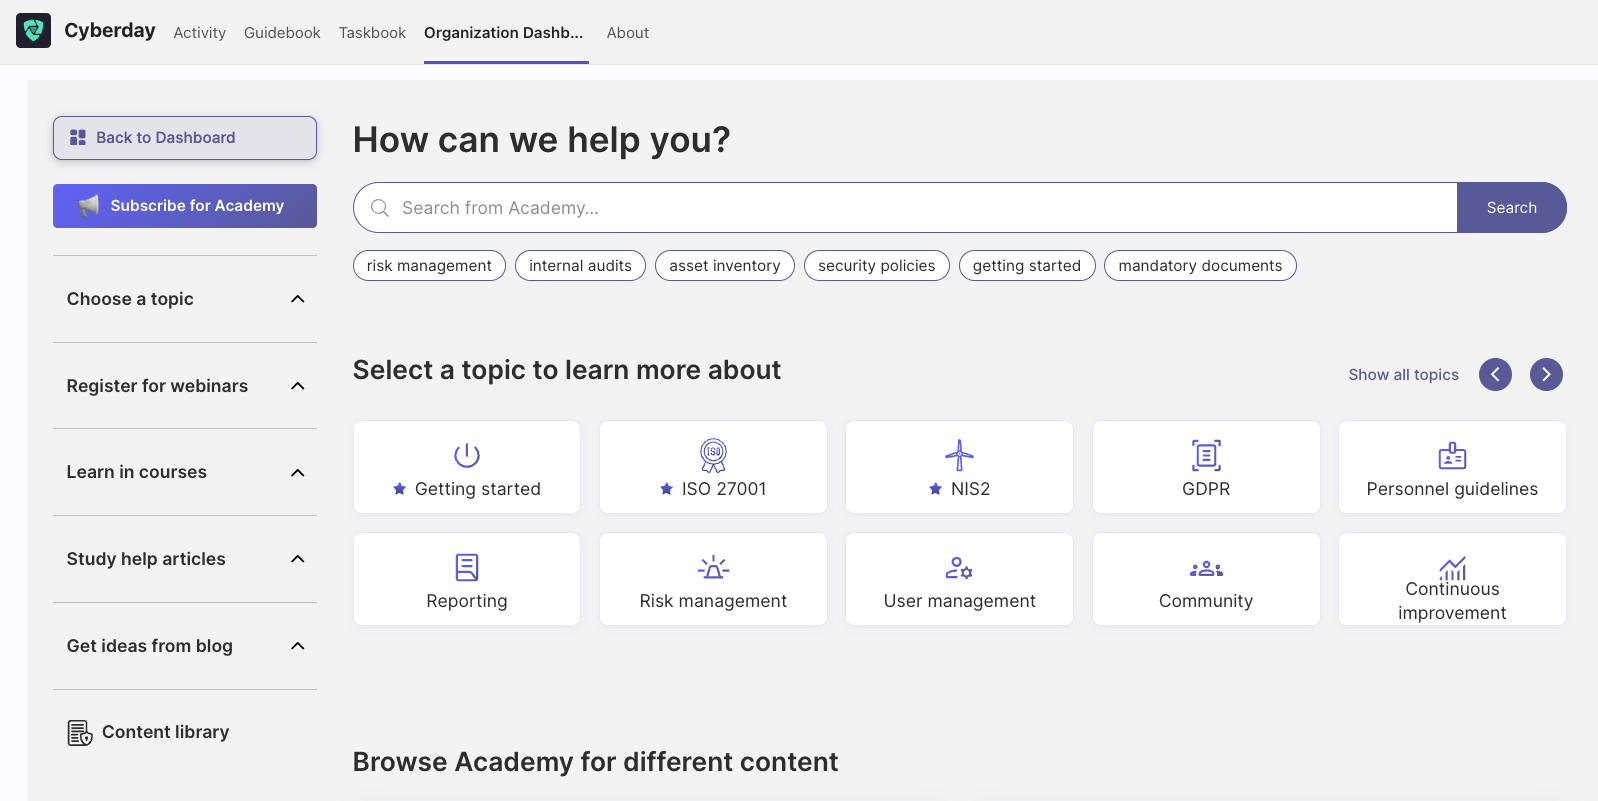
Where can I learn more about Cyberday?
Where to find this view: Dashboard -> More -> Academy
If you would like to learn more about Cyberday and other related topics, you can visit our Academy. Please keep in mind that we might have more materials available in the academy. We are constantly adding and improving our help articles for you. If you have wishes for any specific topics to be added, please contact our team!
Questions and feedback
Do you have any further questions, would need another help article or would like to give some feedback? Please contact our team via team@cyberday.ai or the chat box in the right lower corner.


