


Our documentation cards are by default designed for guided data input.
When you want to observe the connections from this item to others, you can switch to 'visual mode' on a documentation card.
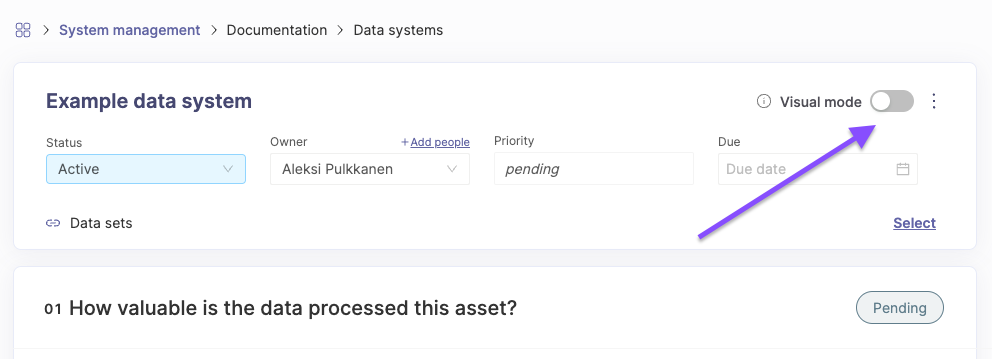
Switching to visual mode
To see the visual mode:
- Navigate to any documentation item
- Click the switch "Visual mode" on top right
This replaces the main contents of the documentation card with a visual representation.
Using the visual mode
The contents you see in the visual mode:
- Directly connected items in the documentation card: This means any items / values you've linked to this item on the questions
- Inlinking items from other lists: You will see the items from other lists that have been linked to this item, pointing inwards to the main node. This could e.g. be a risk linked to a data system on the risk card.
- Secondary connections: This means the items connected to the main connections of this documentation item. E.g. in the image below, you can see that the visual mode shows connections of the "system provider" and "integration" connected to a data system also.

The controls on top left and right corners help you navigate around in the visual mode. You can also use your keyboard to move around.
By clicking a specific node you can see it's connections highlighted in the graph.
Comments, feedback?
We are looking into adding more functionality to the visual mode, e.g. related to navigating to visible nodes.
If you get any wishes on improvements, don't hesitate to contact our team e.g. via chat. 👍


